API Response
This document explains the structure and content of the JSON response from the rock fragmentation analysis API.
Top-Level Fields
deviceId (number): The unique identifier for the device that collected the data.
begin (string): An timestamp indicating the start time of the entire data collection period.
end (string): An timestamp indicating the end time of the entire data collection period.
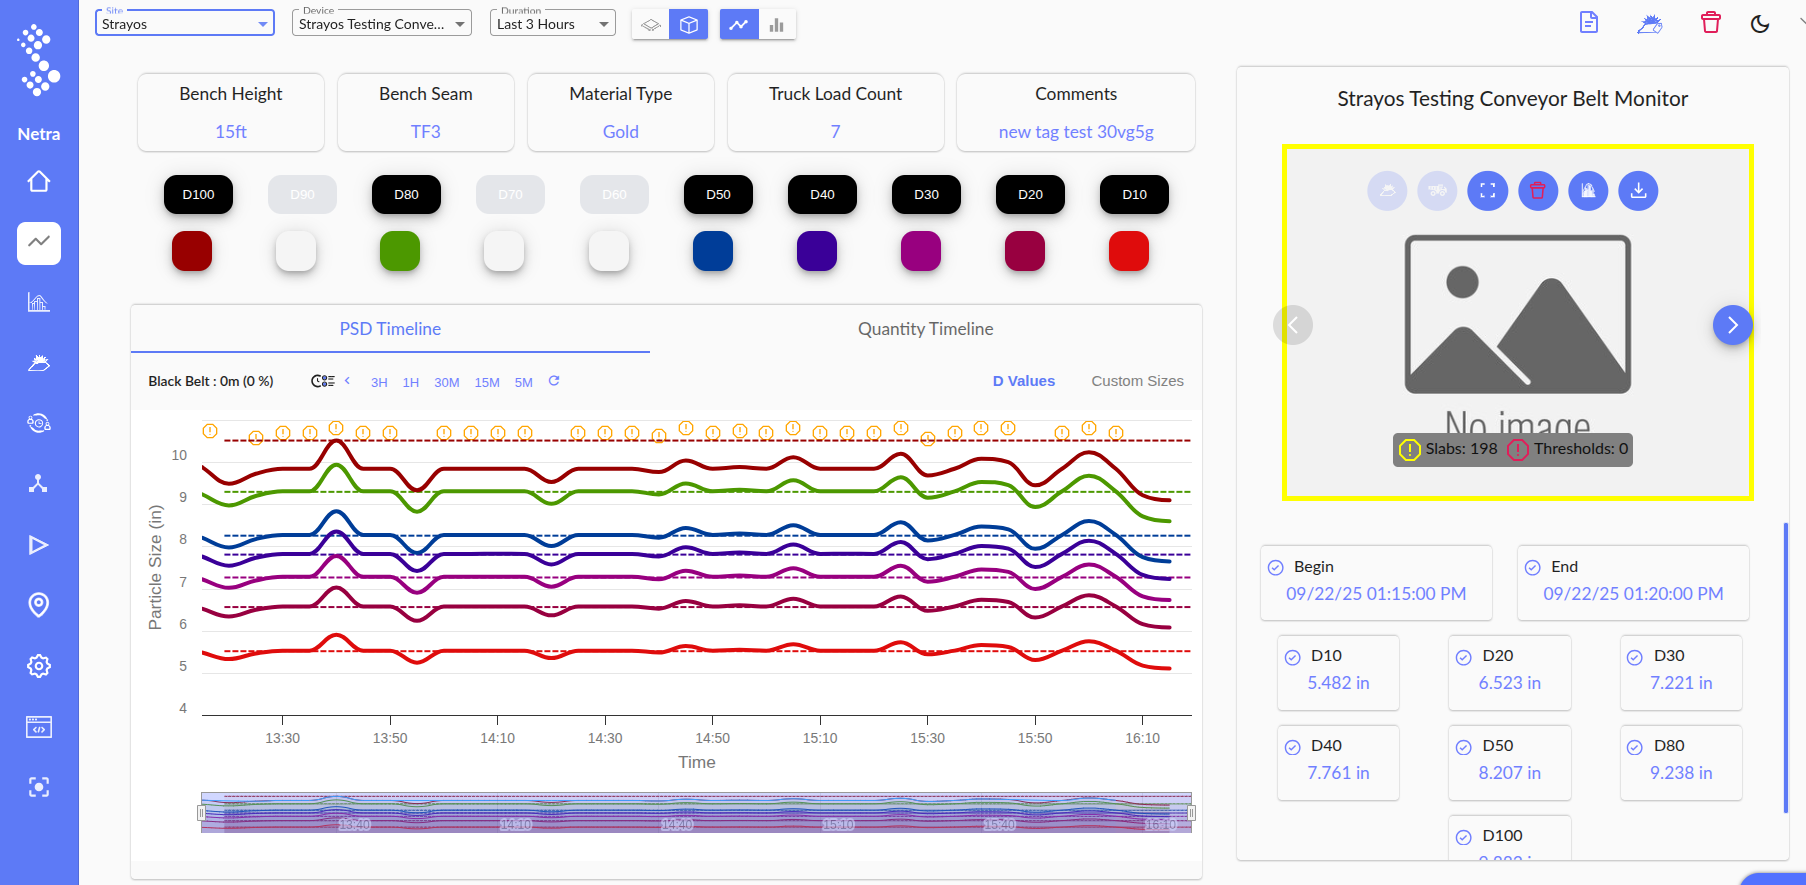
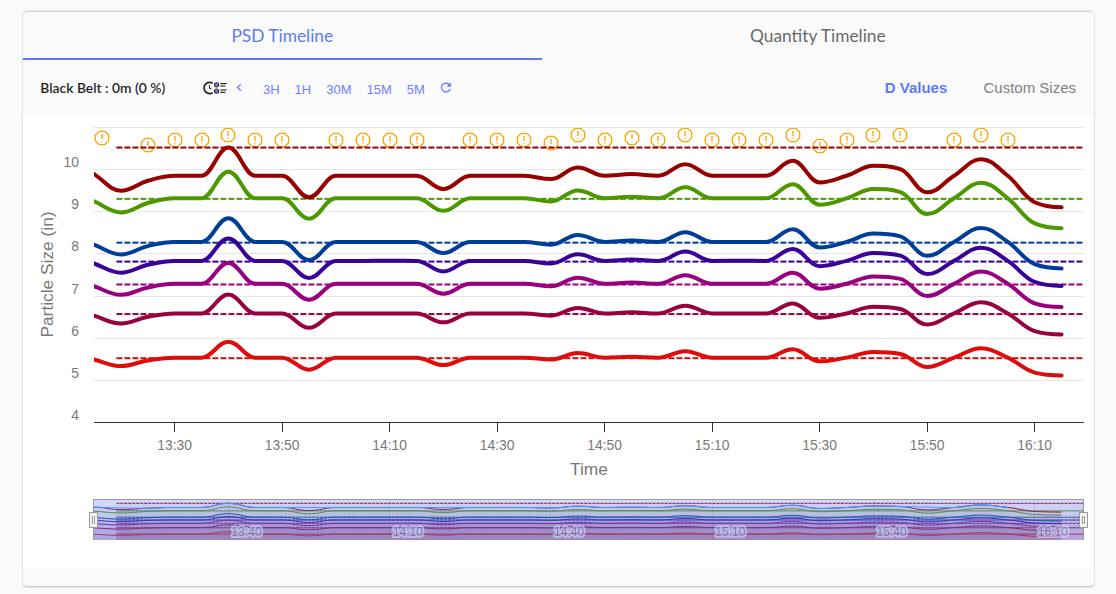
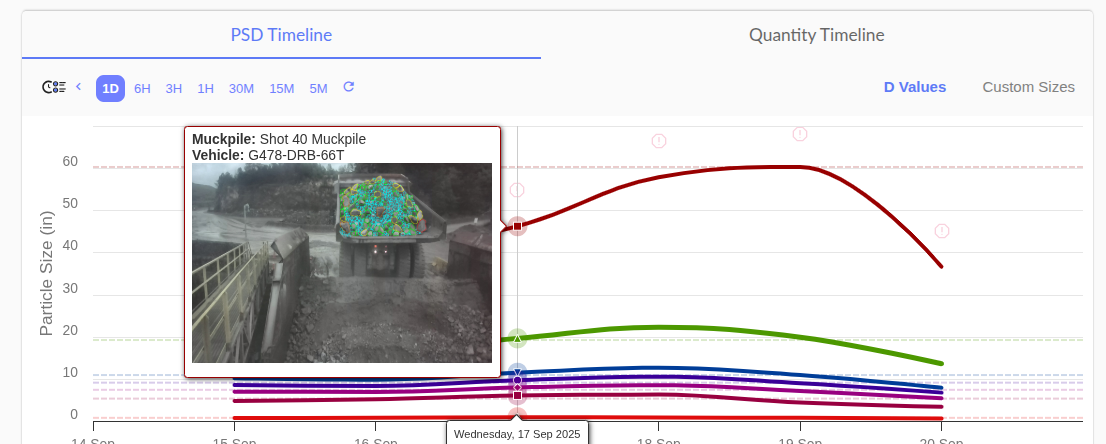
percents (array<number>): An array of predefined percents (e.g., 0, 10, 20, 30, etc.) used for the summary dvalues. As shown in the image, the selected percents are 10, 20, 30, 40, 50, 80, and 100. The timeline chart and dvalues will be displayed according to these selected percents.
intervals (array<object>): An array of individual snapshots. Each object captures the results of a single rock fragmentation measurement.
summary (object): An aggregated summary of all data collected within the begin and end period.
efficiency (number): A calculated efficiency of the belt, often represented as Up time.
totalEmptyDuration (number): The total duration, when the belt was idle (no activity detected), also referred to as black belt time.
totalTime (number): The total duration, of the data collection period.
The intervals Object
Each object within the intervals array provides detailed information for a specific rock fragmentation analysis event.
id (number): A unique identifier for the specific interval.
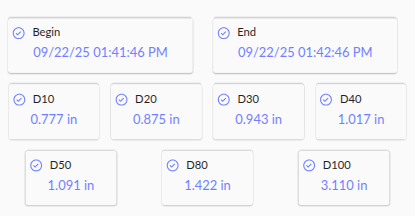
begin (string): The start timestamp of the interval(measurement event), please see in the below image Begin means start time of the interval.
end (string): The end timestamp of the interval(measurement event), please see in the below image End means End time of the interval.
imageUrl (string): A URL linking to a still image captured during the event. This image typically displays the material that was analyzed, as shown in the 'Image' section in the screenshot above.
psd (array<object>): Particle Size Distribution (PSD) data for this specific interval. This is an array of objects, where each object has:
data (array<number>): Raw particle size data, representing key points on the Particle Size Distribution (PSD) curve (e.g., D10, D50, D80). This data is stored in the base unit (meters) and automatically converted to the user's selected unit for display.
customSizePercents (array<number>): An array that appears to hold custom percentile values for analysis.
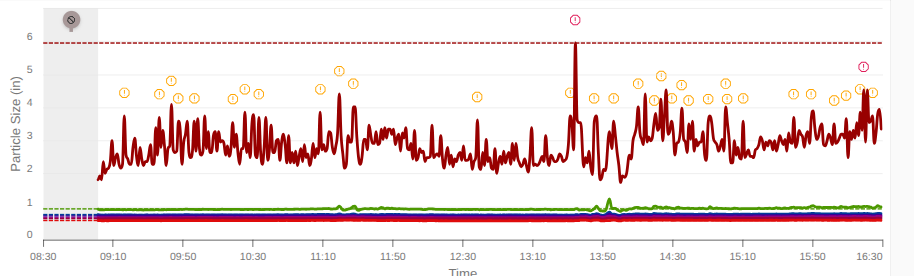
slabs (number): The count of large "slabs" or oversize rocks detected. This is highlighted by a yellow alert.
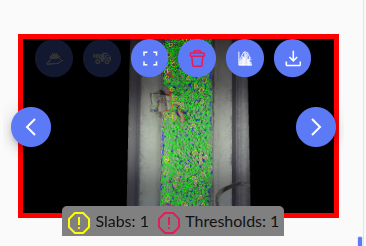
thresholdCount (number): The number of times a certain threshold (e.g., for rock size) was exceeded during the interval. This is highlighted by a red alert.
muckpileId (null): An identifier for a pile of excavated rock (muckpile), if applicable.
vehicleId (null): An identifier for the vehicle involved in the operation, if applicable.
The summary Object
The summary object provides a consolidated view of all the data from the intervals array.
dvalues (object): The dvalues object is the most important part of the summary. These numbers tell you the size of the rock at different percentiles. For example, the
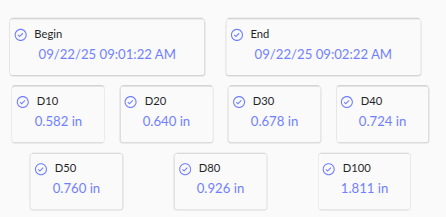
50 key shows the size where 50% of the material is smaller than that value. This is a crucial metric, often called the P50 or D50. It gives you a single number to quickly judge the overall fragmentation quality.psd (array<object>): The aggregated Particle Size Distribution (PSD) data for the entire analysis period. This works the same way as the psd field in the intervals, but it represents the average distribution.
totalWeight (number): The total estimated weight of the analyzed material across all intervals.
customSizePercents (array<number>): Similar to the field in intervals, this holds custom percent values for the summary data.
Related Articles
Generating Access Token for Data API & Reports
Generating Access Token for Data API & Reports Overview: This documentation provides instructions for generating an access token to enable the generation and download of Data API and Reports. The generated token grants access to the necessary ...Import Your Data/Live Interval Tag via Email
Overview: This tutorial explains how to easily upload your interval tag data by simply sending an email with a CSV attachment. This process is fully automated, so your data will be stored in our system without any extra steps. Steps to Import ...